3.6 Collaboration overview (including thesaurus)
Creating overviews with the Author as linking pin can be beneficial for several reasons. For researchers it may help find colleagues to collaborate with as they are already doing similar research or get people that may introduce you through their network. Especially when you need to tender for a large grant, this can be really helpful (note: you can also use the affiliation as base to find where the research is done). For policy makers this analysis may help in visualizing collaborations within and outside of your institution, as these collaborations are often described in multi year plans.
For this analysis we will be looking at internal collaborations within Leiden University. As we start from journal articles, where authors from multiple universities may have contributed, we need to do some additional steps with the data from Web of Science to exclude the non-Leiden authors. For this we use a Python script. If you want to follow along, you can copy the code at the top right of the code box.
We also use a thesaurus in this chapter. With a thesaurus you can tell VOSviewer that some terms are similar (or in our case authors) so they will be analysed as one.
This chapter contains some advanced techniques such as the thesaurus and working with Web of Science data in Python. Those parts can be skipped if you just want to know about creating basic overviews
We start by downloading all Leiden University articles in the last 5 years from Web of Science. For this go to Web of Science, as filter choose ‘Affiliation’ with ‘LEIDEN UNIVERSITY’ as value. Set the time range to last 5 years.
Export the records as tab delimited files (500 at a time) and save these files to a new directory.
We will now create a Python script to filter out the non-Leiden authors. At the top of our Python file we will import the Python libraries needed to do the transformation:
import pandas as pd #for working with the data in our tab delimited files
import os #for accessing the data files- The first step is to load all data from the exported files into the Pandas framework:
frames = []
file_dir = 'leiden_university' #choose the directory where the exports are in, relative to your Python file

for filename in os.listdir(file_dir):
    frames.append(pd.read_csv(file_dir +"/"+ filename, sep="\t", header=0))
all_articles = pd.concat(frames, ignore_index=True)- We know all of our affiliation information is in a column called ‘C1’ (example: [Zananiri, Sary] Leiden Univ, LUCL, Leiden, Netherlands; [Zananiri, Sary] Leiden Univ, NINO, Leiden, Netherlands), while the authors are in a column called AU (example: Zananiri, S) and AF (example: Zananiry, Sary). Let’s process the columns based on the information in C1, and take as premisse that all affiliations containing ‘leiden’ are ok (technically this may include a very minor number of authors from companies based in Leiden, but affiliation information can be quite difficult as affiliations noted as Sterrewacht Leiden also mean the university).
authors = [] #to keep track of all different authors
all_articles = all_articles.reset_index()
for ind, row in all_articles.iterrows():
    line = row['C1']
    institution_lines = line.split("[")
    author_initials = ""
    author_full = ""
    institution_aff = ""
    for institution_line in institution_lines:
        line_parts = institution_line.split("]")
        if len(line_parts)>1:
            if line_parts[1].lower().find('leiden')>=0: # we consider it internal
                names = line_parts[0].split(";")
                for name in names:
                    name_parts = name.split(",")
                    if len(name_parts)>1:
                        first_name = name_parts[1]
                        last_name = name_parts[0]
                        initials = ""
                        init_parts = name_parts[1].split(" ")
                        for init_part in init_parts:
                            initials = initials + init_part[:1] + "."
                        if len(author_full)==0:
                            author_full = last_name +", "+first_name
                            author_initials = last_name + ", " + initials
                        else:
                            author_full = author_full + "; " + last_name +", "+first_name
                            author_initials = author_initials + "; " + last_name + ", " + initials
                        if (last_name+", "+first_name).strip() not in authors:
                            authors.append((last_name+", "+first_name).strip())
    all_articles.loc[ind, "AF"] = author_full.strip()
all_articles.loc[ind, "AU"] = author_initials.strip()- Next we have to bring the authors back into a table that VOSviewer can work with. Therefore we will create a tab delimited text file and we will also create a thesaurus of authors to use later on.
all_articles.to_csv('leiden_only.txt', sep='\t')
file = open('leiden_thesaurus.txt', 'w+')
content = "\n".join(authors)
file.write(content)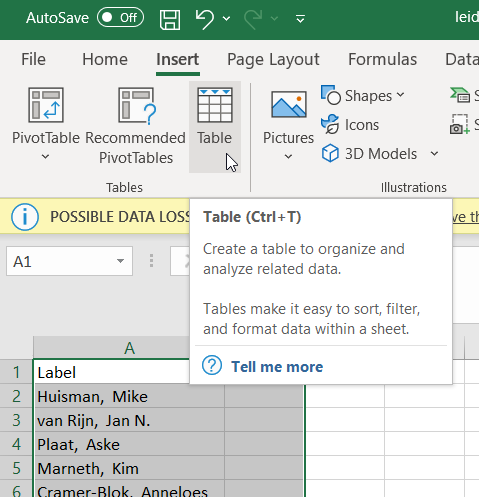
file.close()- Next step is to create our thesaurus. Open the file ‘leiden_thesaurus.txt’ in Excel. Add a row to the top and enter the following column names: ‘Label’ in the first cell and ‘Replace by’ in the second. Next we will make a table by selecting all text and choosing ‘Table’ from the ‘Insert’ ribbon.
img
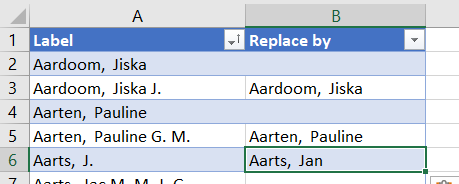
- Sort the labels from A-Z and check if you see double entries. We will put the value we want in their ‘Replace by’ column. Be sure to also check out the names with middle names (either before the last or after the first name).
img
By looking at the table you most likely have noted how many names are spelled in several ways. A good indication is the number of authors mentioned in the file (almost 8 thousand), which is larger than the number of researchers we have. Difficult names such as Simon F. Portegies Zwart (double last name!) will also throw Web of Science. You will also notice there is a big problem with names that only have initials in the full name field. We might say it is easier to choose names with initials, but that strategy is more error prone once you have common names such as the Chinese Wang or Dutch De Jong.
Next we filter the ‘Replace by’ column on A-Z and delete the names at the bottom we don’t replace. This is necessary to prevent them being replaced with a blank. NOTE: For the example I did not do all names due to time constraints, but see file leiden_thesaurus_replace.txt for the output I used.
Export the file via ‘File’->‘Export’->‘Change File Type’->‘Text (tab delimited)’
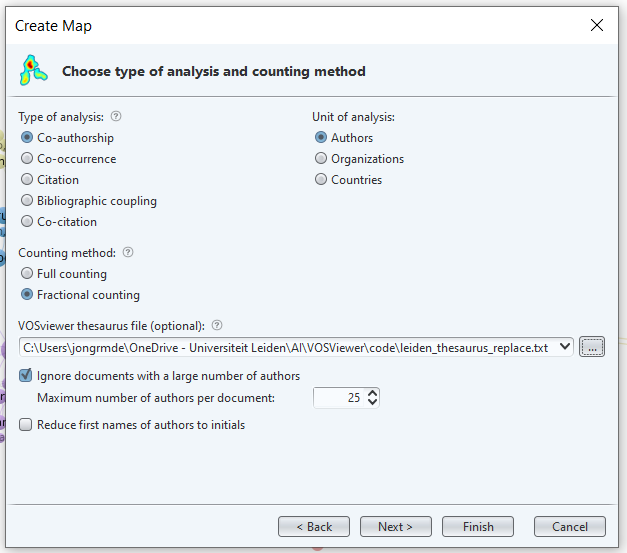
Create a new map in VOS Viewer. Base on ‘Create a map based on bibliographic data’ -> ‘Read data from bibliographic database files’ go to tab ‘Web of Science’ and choose the leiden_only.txt file. Choose the ‘Co-authorship’ map based on ‘Authors’ and use our thesaurus file.
img
Choose the number of documents, this may be a bit lower, as many authors will most likely drop from the list for lack of internal collaboration.
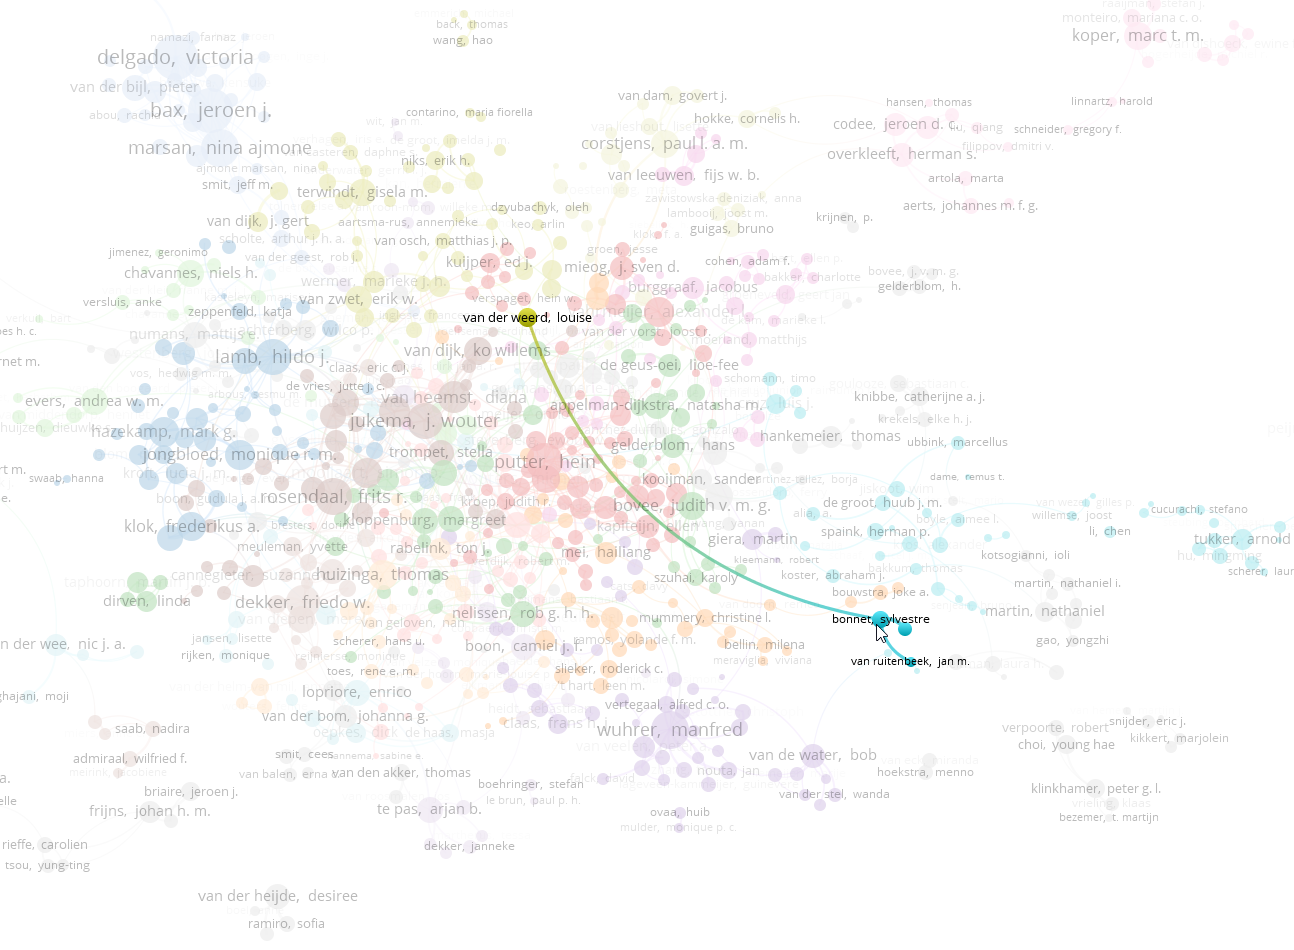
e now have a very colored map with many small clusters. If you study them closely, each cluster will most likely be a research group. You may notice that some clusters from the same institute do not connect much with others (for this year): for example if I look at the chemistry institute, I see little connection between Herman Overkleeft and Sylvestre Bonnet. But Bonnet does have a strong connection with Louise van der Weerd who works on MRI and imaging techniques at LUMC. This is because Bonnet is an inorganic catalyst expert and uses techniques quite different from that of bio-organic synthesis expert Herman Overkleeft.
img