3.3 Finding the seminal papers in the field
How do we define what are the most important articles in a specific field? First of all, we start from a selected set of articles that define our field well. For this demonstration we will use the articles from the previous exercise that are somehow connected to VOSviewer. (Please note, it works better with a specific topic, however these articles are bound by an interest in science mapping)
It is important that we do have a broad set of articles here. VOSviewer works solely with the documents within your set and the linkage (citation-reference) between these documents. Limiting your research set to for example the last 5 years, will mean that you will only find important articles in the field that were written within these 5 years (also note: recent articles are unlikely to be cited on a large scale so realistically the articles from 3-5 years ago will pop-up).
TIP: There are several options for clustering articles. In order to find seminal articles, we use citation linking as base (which articles are the most referred to in this set). For other purposes we may use bibliographic coupling, where we look at the references articles share and are thus able to find very similar articles.
The articles that are truly groundbreaking within a field, commonly known as seminal papers, will be the ones that are referred to most often by other articles within the set, as they are essential to understanding the theory. This is different from sorting your results for citations in a database: within VOSviewer you only look at articles from the field, from your selection. So an article that is important to another field, or that has general importance, will not automatically show up. But an article with relatively few overall citations that is referred to a lot in the set, will. Again the clustering algorithm used in VOSviewer will ensure that similar publications (based on the references) are shown close together.
Go to VOSviewer and click on the Create button. This time we want to ‘Create a map based on bibliographic data’.
We start with ‘Read data from bibliographic files’ and use the same set as in the previous text map.
We now have a screen with many options for analysis. Have a look as these can all be used to visualize specific information such as collaborations, what universities are working on a specific topic, which journals are best to publish in etc. As we want to know the seminal papers (within the set!) we choose the option ‘Citation’ and go for an analysis on ‘Documents’. (if you need to know what journals are popular, or which authors to contact, you can choose one of the other units of analysis)
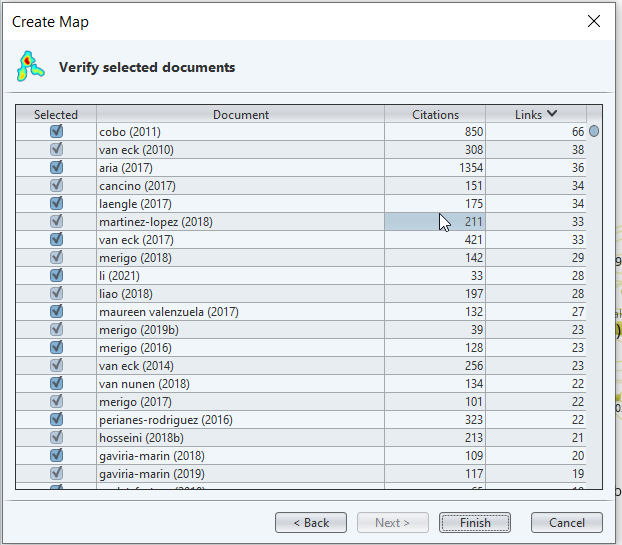
Next we are asked to choose a threshold value for the inclusion of an article. A seminal paper will have quite a few citations, so I suggest not to set this value too low. The number of citations is in this case taken from the total number of citations within the source, not the citations within the set. I opted for 20 citations as threshold here.
I leave the number of documents as is. If the number is very large (above 1,000) I would recommend lowering it.
The next screen gives a clear view of the differences in links (within the set that was selected based on the threshold!) and citations (total number). At the bottom is for example an article by Van der Maaten that has 1190 citations, but no links within the set. In other words, it most likely is not of interest if you are doing scientometrics research (as our set was based of a scientometrics article as common link between the publications). You can ignore these unlinked documents and don’t have to uncheck them manually, as the next question is about their inclusion. Click ‘Yes’ to leave them out.
img
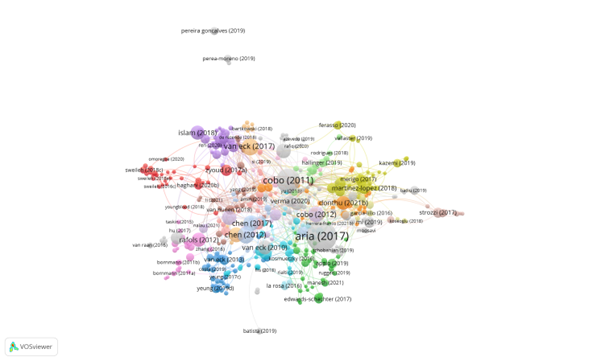
- Our map now looks like this:
img
- You can see the links by articles, but by default the visualization focuses on the total number of citations for the dot size of an article. You can change this in the right menu by choosing ‘Links’. (Another option is normalized citations: this is normalized by publication year as older publications have had more citation possibilities).
img
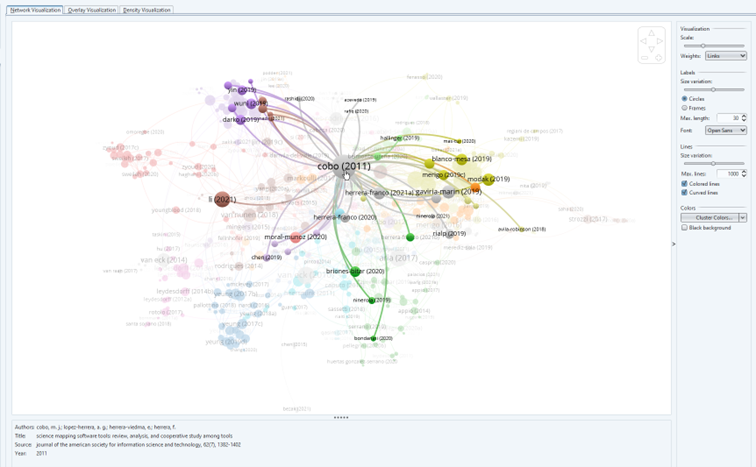
Hovering over an article will give you its basic information. If a DOI is available, clicking on the dot will get you to the article.
The clusters are a bit more over the place in this analysis. That may be because some of the clusters were of interest to many articles. For example, the grey cluster Cobo belongs to, is all about bibliometric tools. The yellow cluster is about history. The brown cluster about using scientometrics in safety research.